Back to Main
Dot.
Dot — Web3 is a product based on a Telegram application designed to visually display the user's cryptocurrency portfolio. The main idea of the product is to simplify the understanding of the state of assets and make working with the crypto portfolio more transparent and user—friendly.
Задачи и цели
To make a clear and accessible interface for displaying a cryptographic portfolio
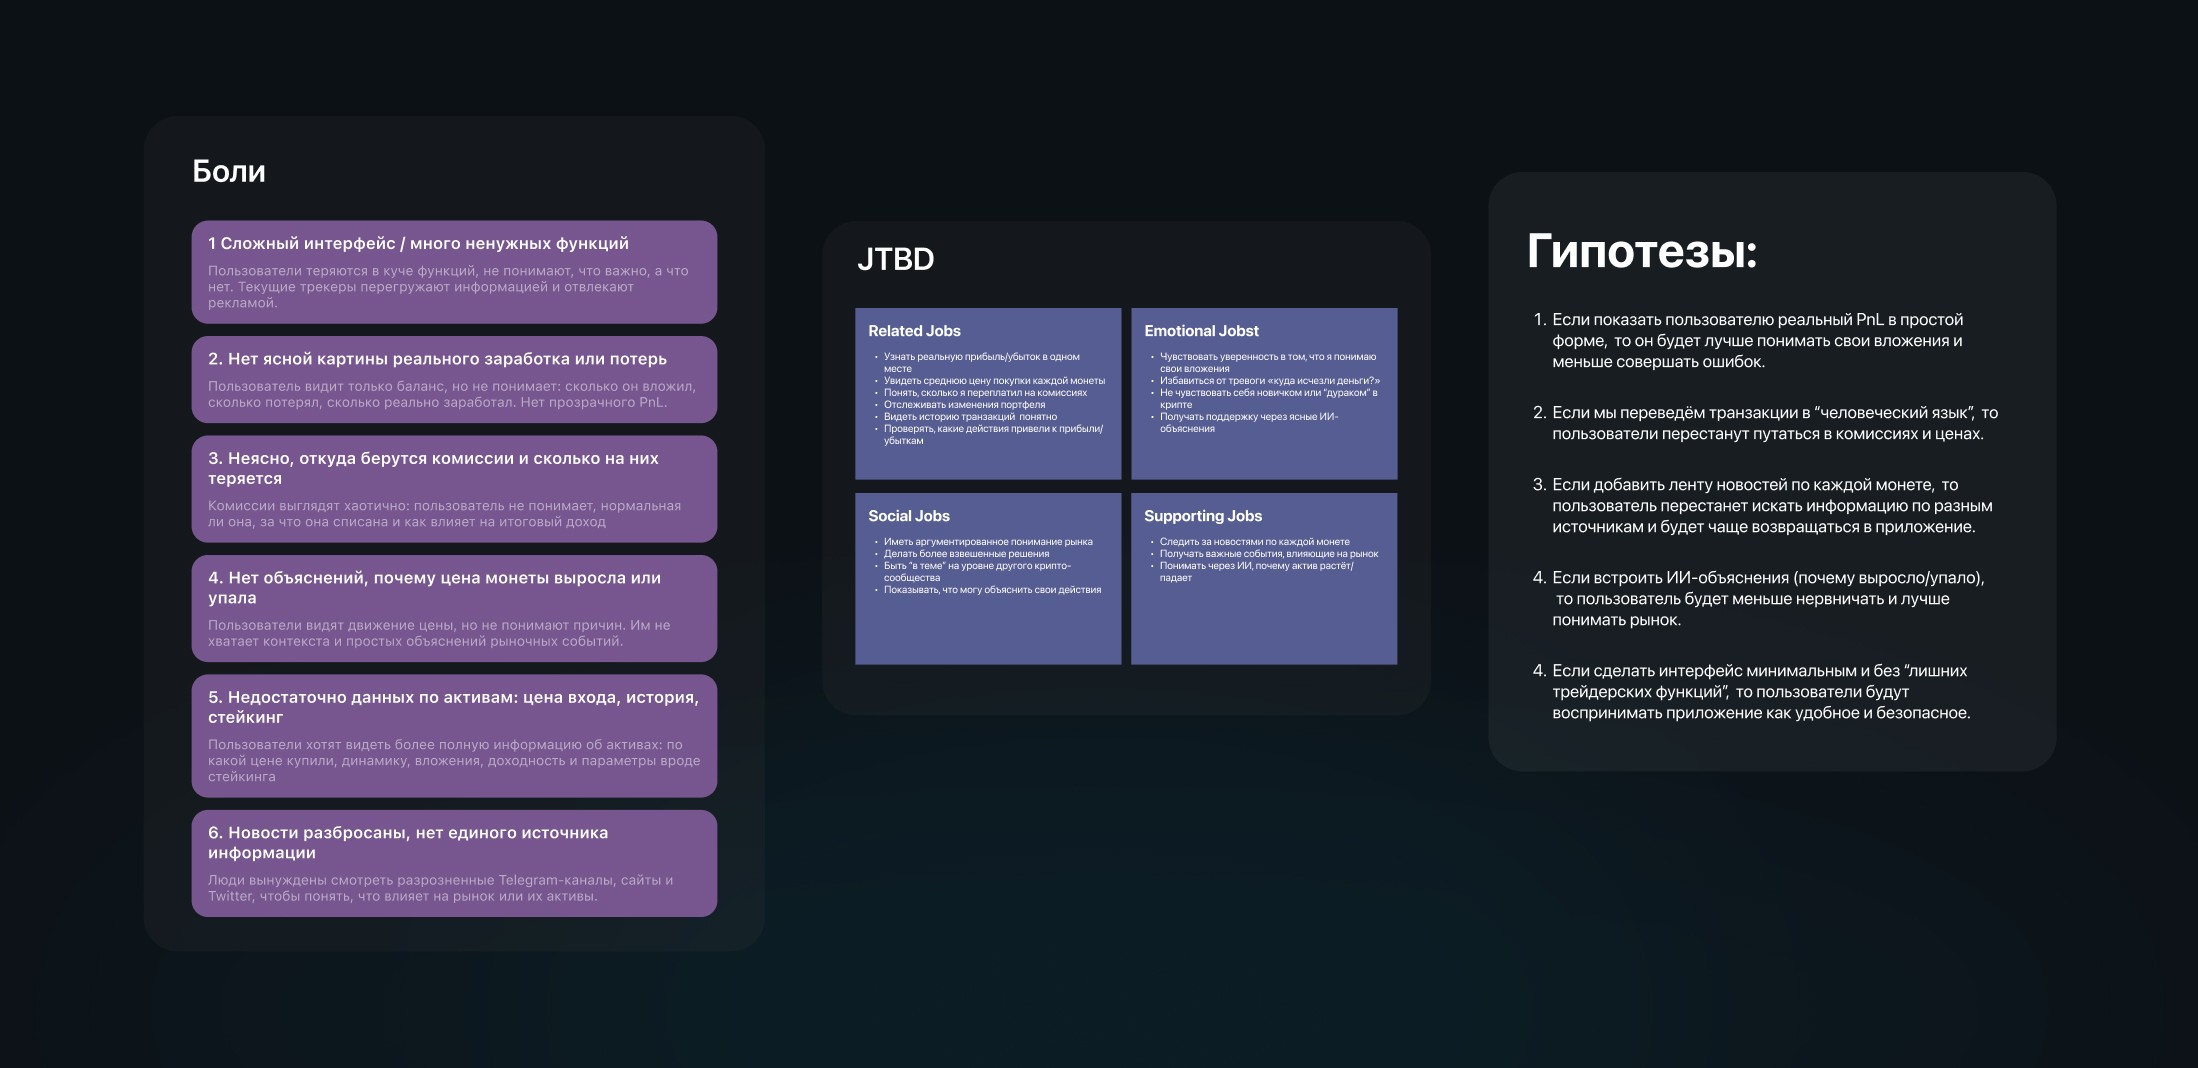
Take into account real user pain and scenarios of working with crypto assets
Explore existing solutions on the market and identify best practices
Design an interface appropriate to the Web3 context and modern visual trends
Prepare a design system for further scaling of the product
What was done
A user survey was conducted to understand:
how do they manage the crypto portfolio;
What problems are they facing?;
which solutions are considered convenient
Также:
Based on user insights, a competitive analysis of key crypto applications (Binance, MetaMask, ByBit, TG WALLET) was conducted
The functionality has been developed taking into account consultations with an expert immersed in the crypto industry
A UX prototype has been created that reflects the main use cases of the product.
The UI has been developed taking into account current Web3 design trends
The UI Kit has been assembled and variables have been configured in Figma to simplify further work with the design.
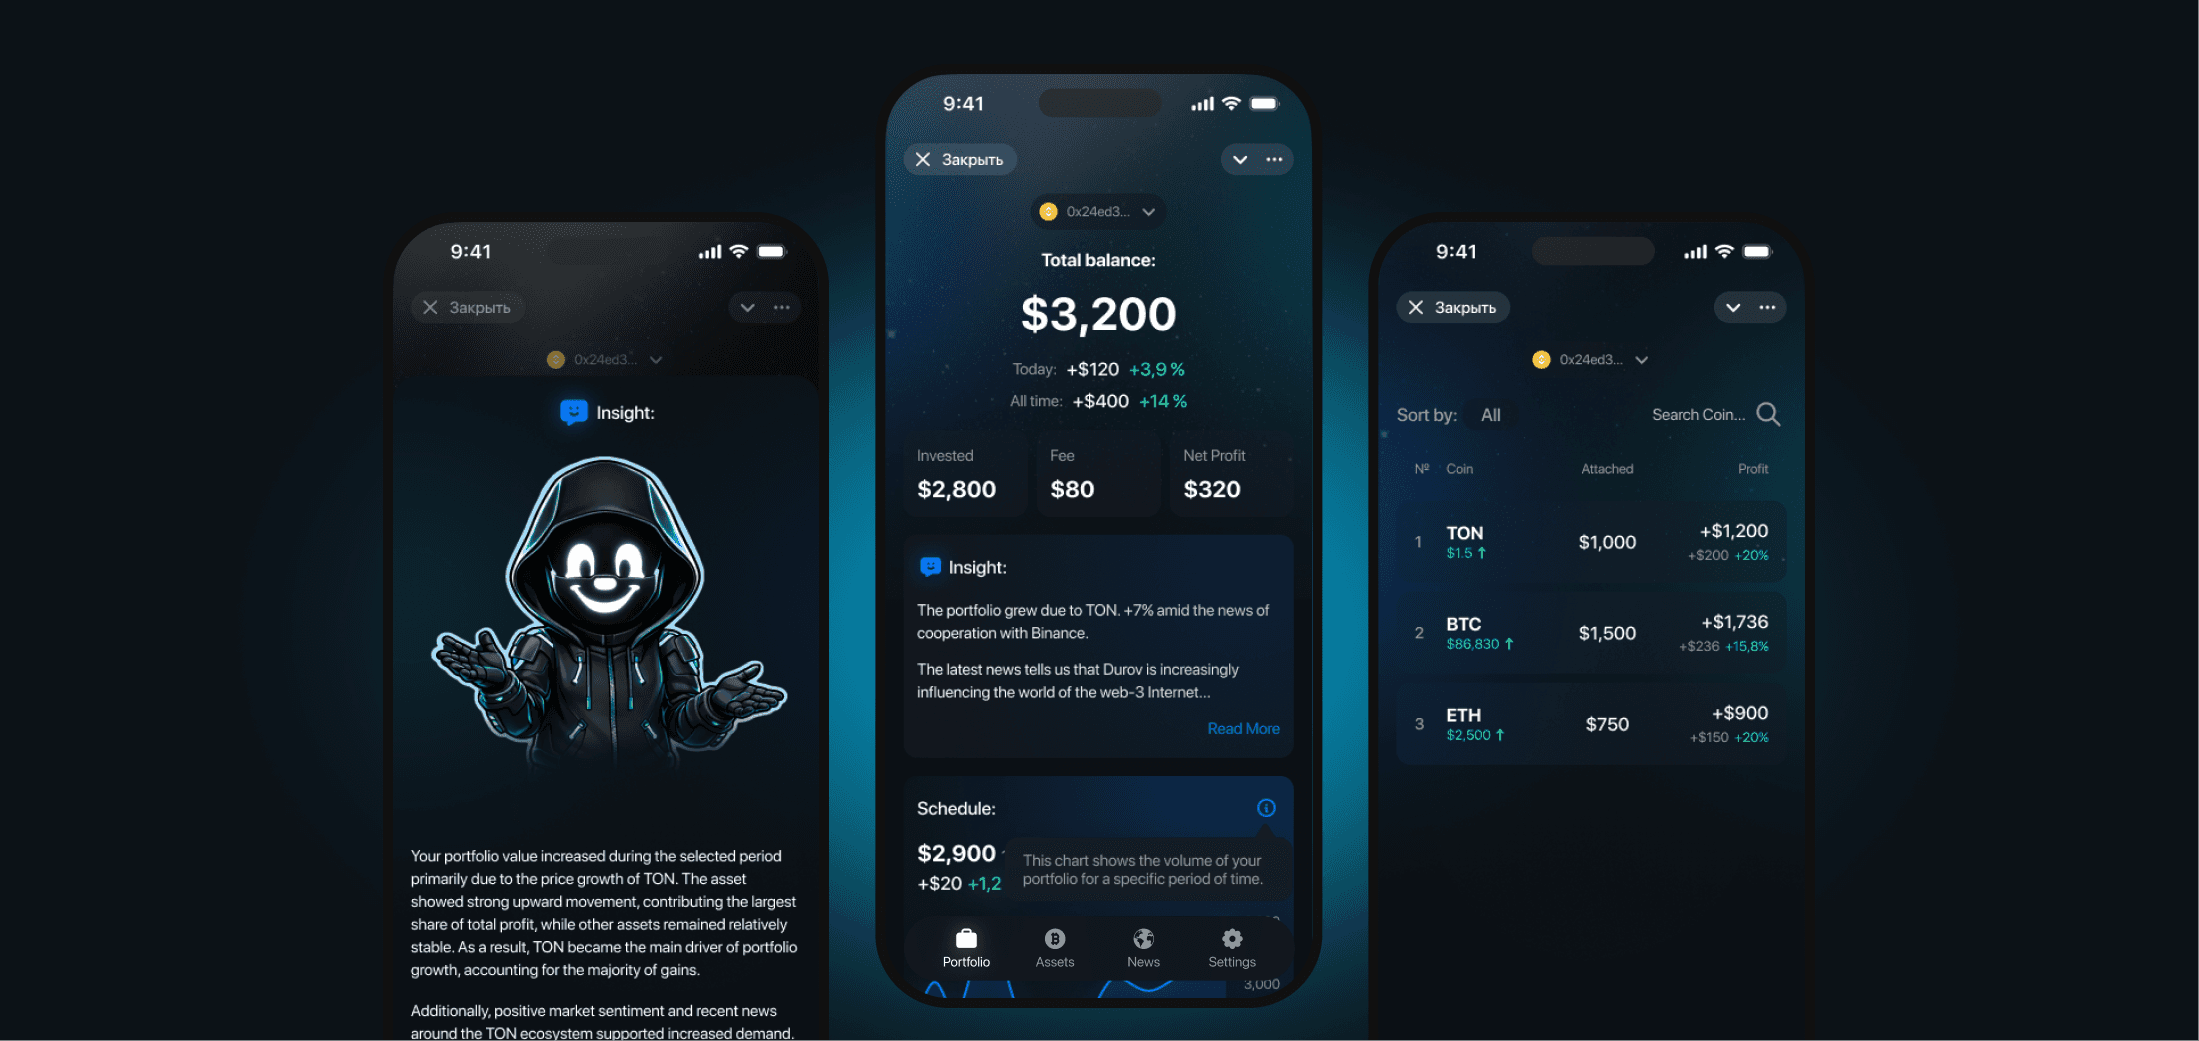
Briefcase Screen
The figures of the total balance of the entire portfolio are displayed, with the PnL of today and all the time. It clearly shows how much money is invested, how much is spent on commissions and what is the profit in the portfolio.
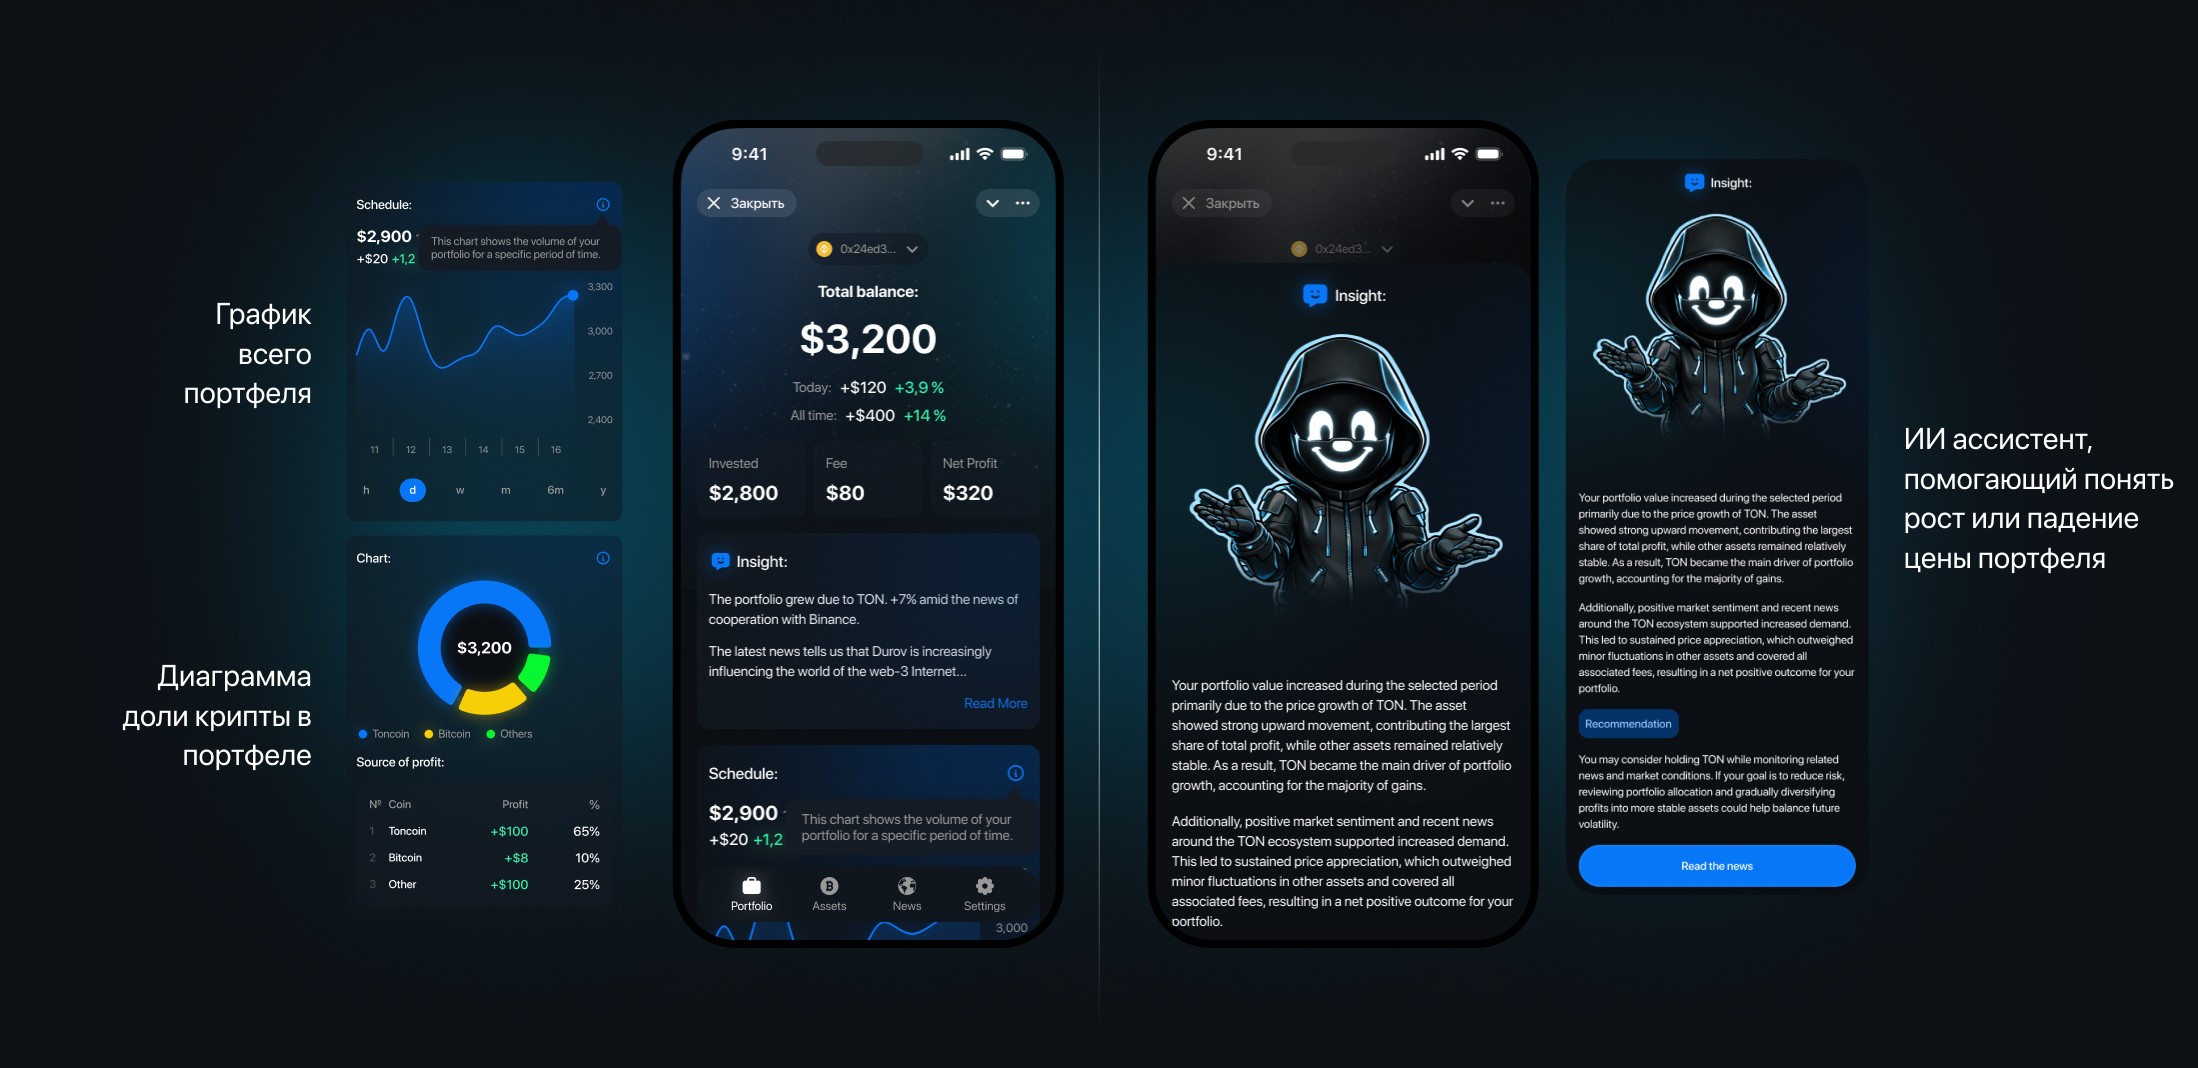
Also, according to AI, an explanation is given as to why the portfolio has grown/fallen, and what news has influenced it.
The graph shows the trend of the portfolio, and a chart is also available to understand the shares of cryptocurrencies in the portfolio.
Briefcase
The figures of the total balance of the entire portfolio are displayed, with the PnL of today and all the time. It clearly shows how much money is invested, how much is spent on commissions and what is the profit in the portfolio.
Also, according to AI, an explanation is given as to why the portfolio has grown/fallen, and what news has influenced it.
The graph shows the trend of the portfolio, and a chart is also available to understand the shares of cryptocurrencies in the portfolio.
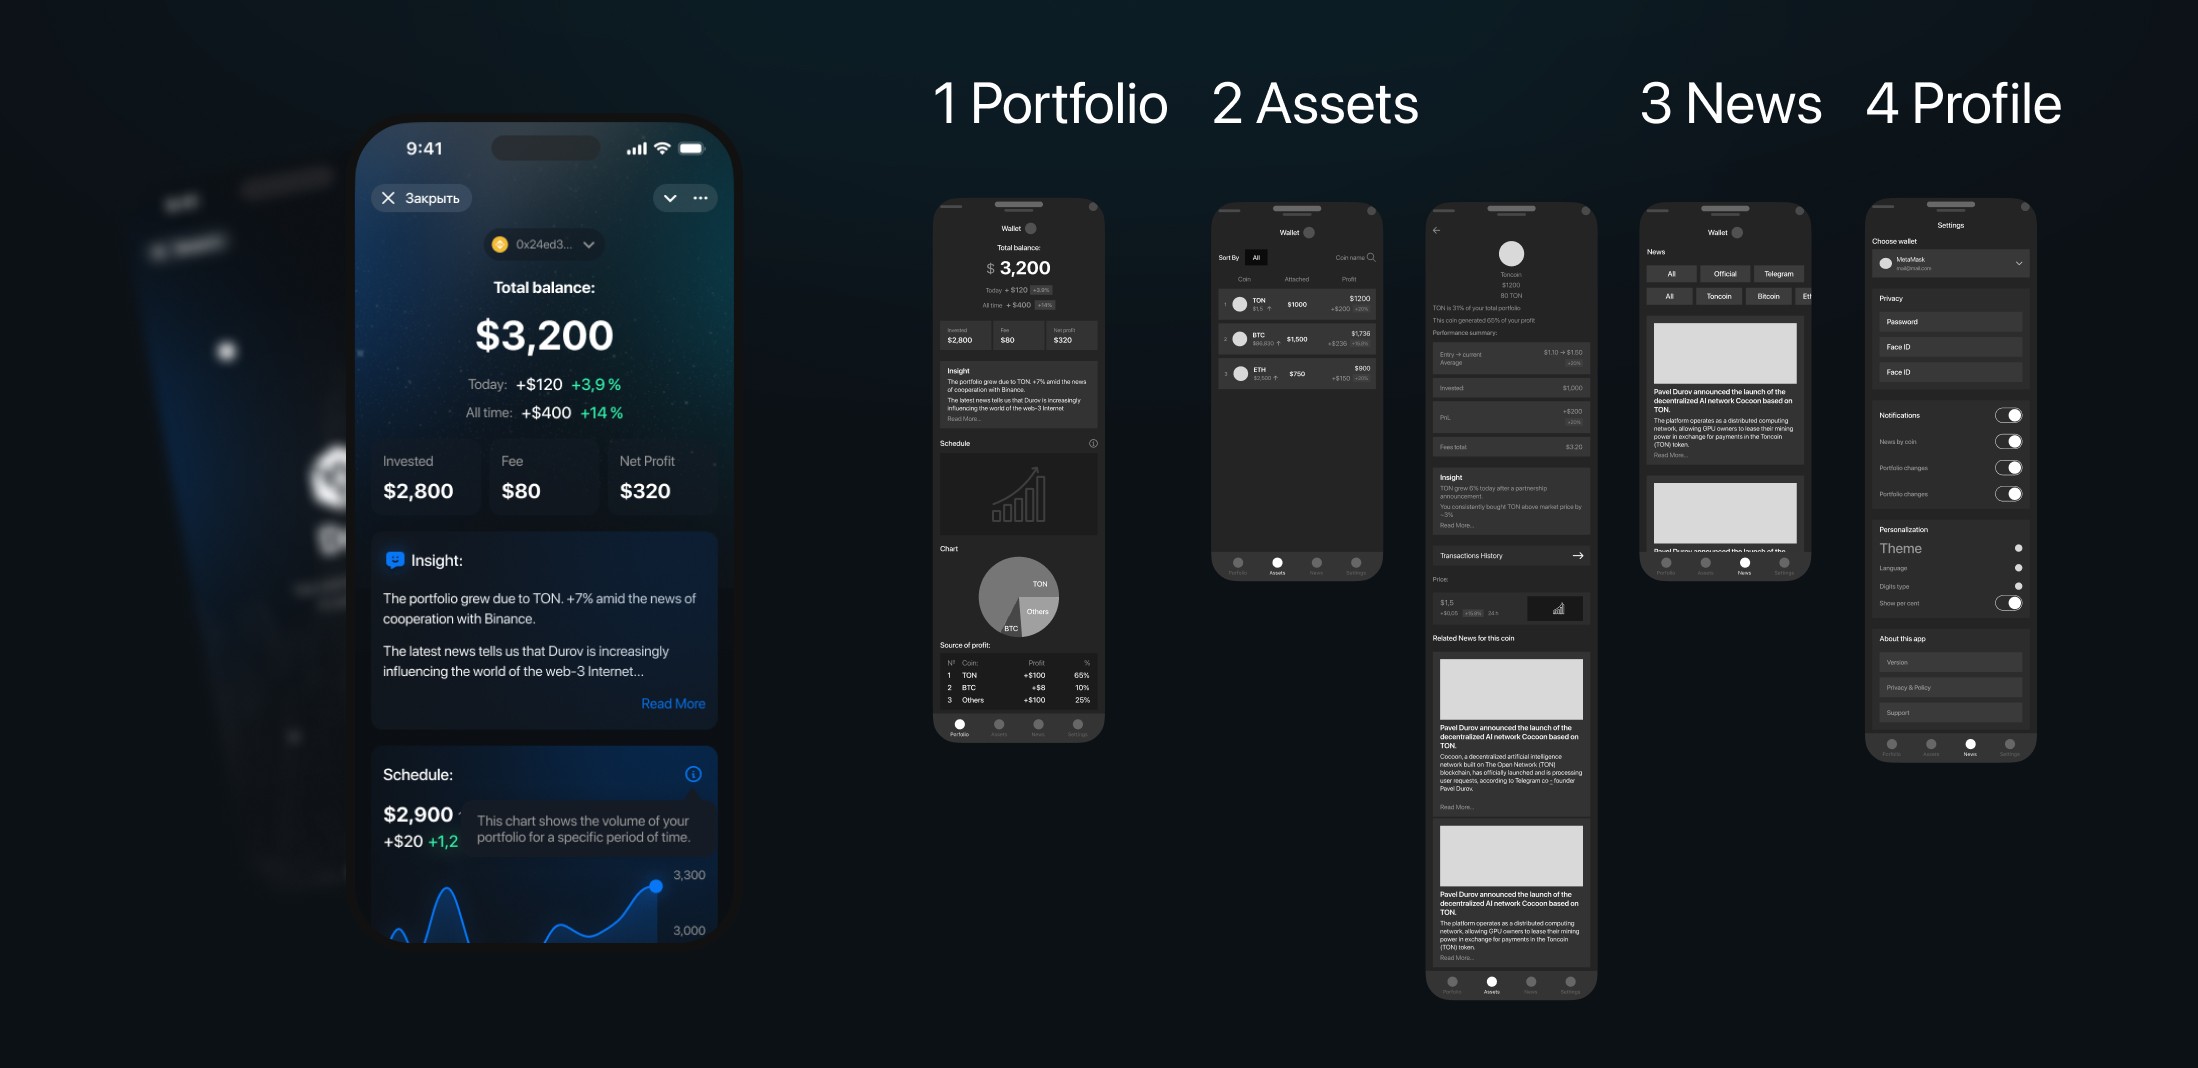
Assets
The user can view the list of assets in the portfolio, how much is invested and what income is derived from it. It can also be sorted by profitability, unprofitability. In the case of a large amount of crypts in the portfolio, you can add a specific coin to the search for convenience.
When clicking on the panel of a separate coin, the user falls into a detailed report on the crypt.
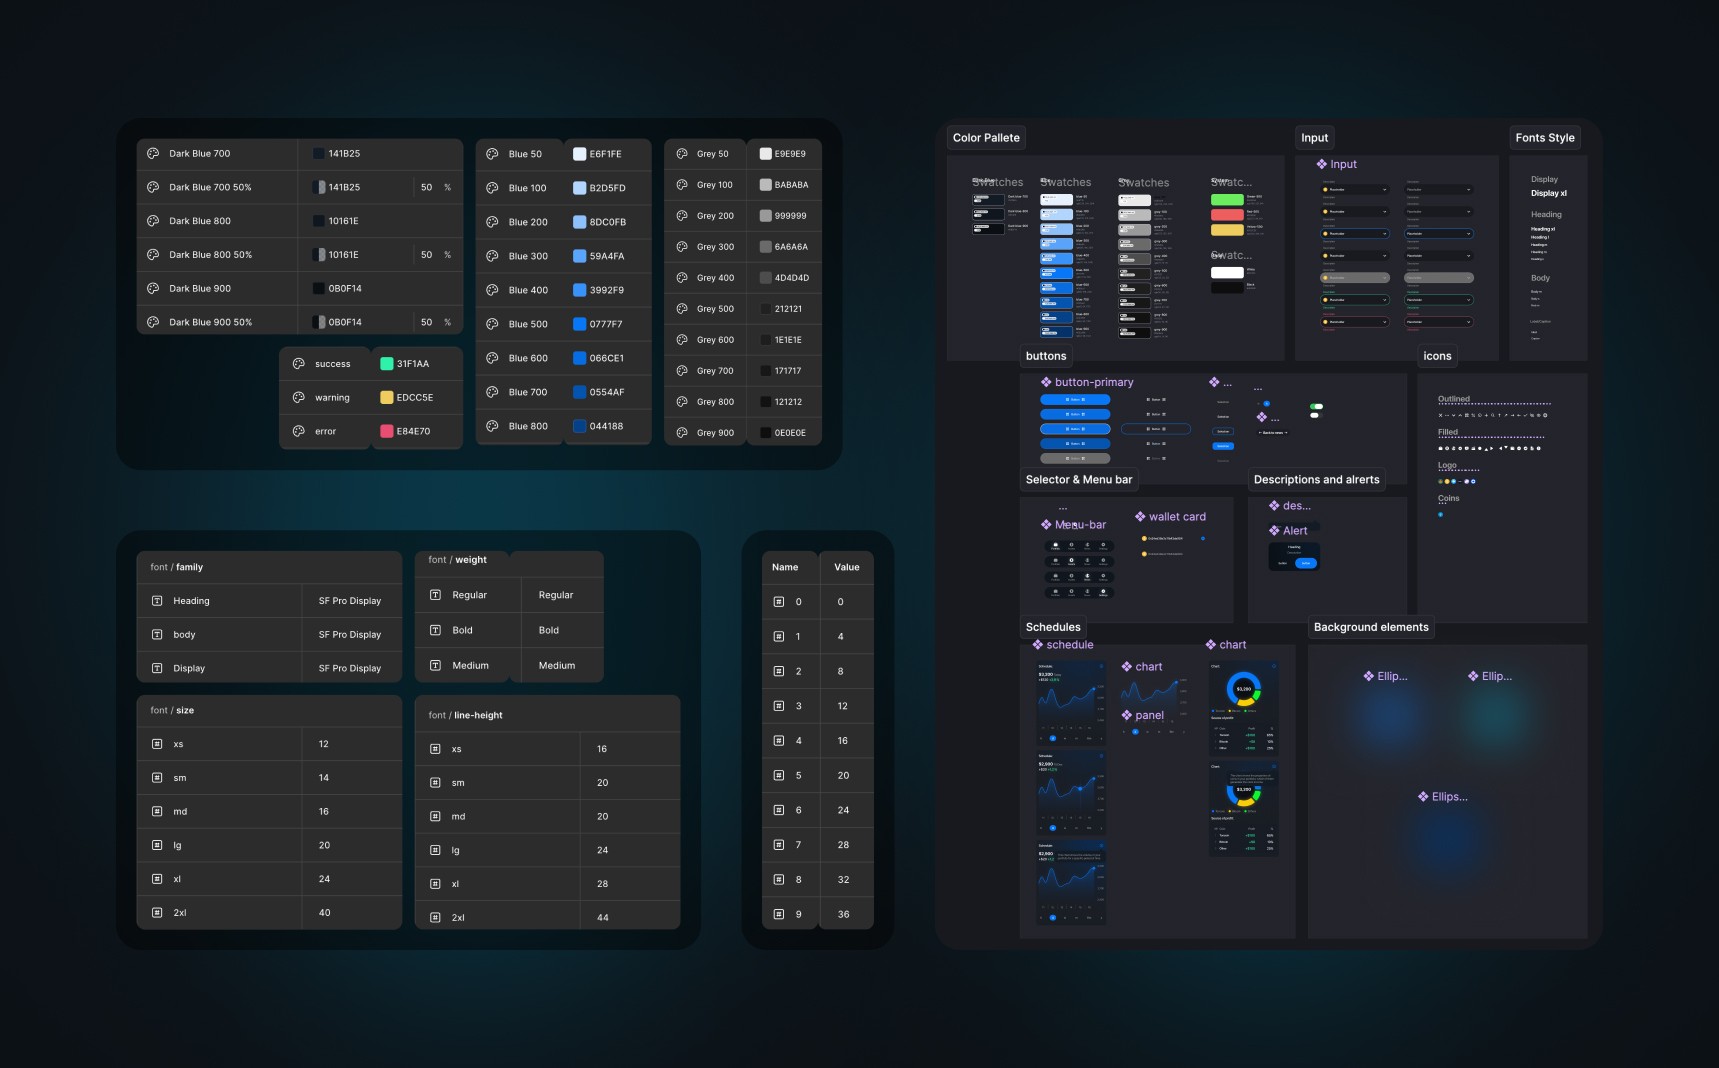
UI Kit & Tokens
Thanks for watching!
Back to Main